ANT pre-IPO contracts closed as high as $110.37, well above Anthropic’s $74 IPO midpoint, ahead of the planned Nov. 19 Nasdaq debut.
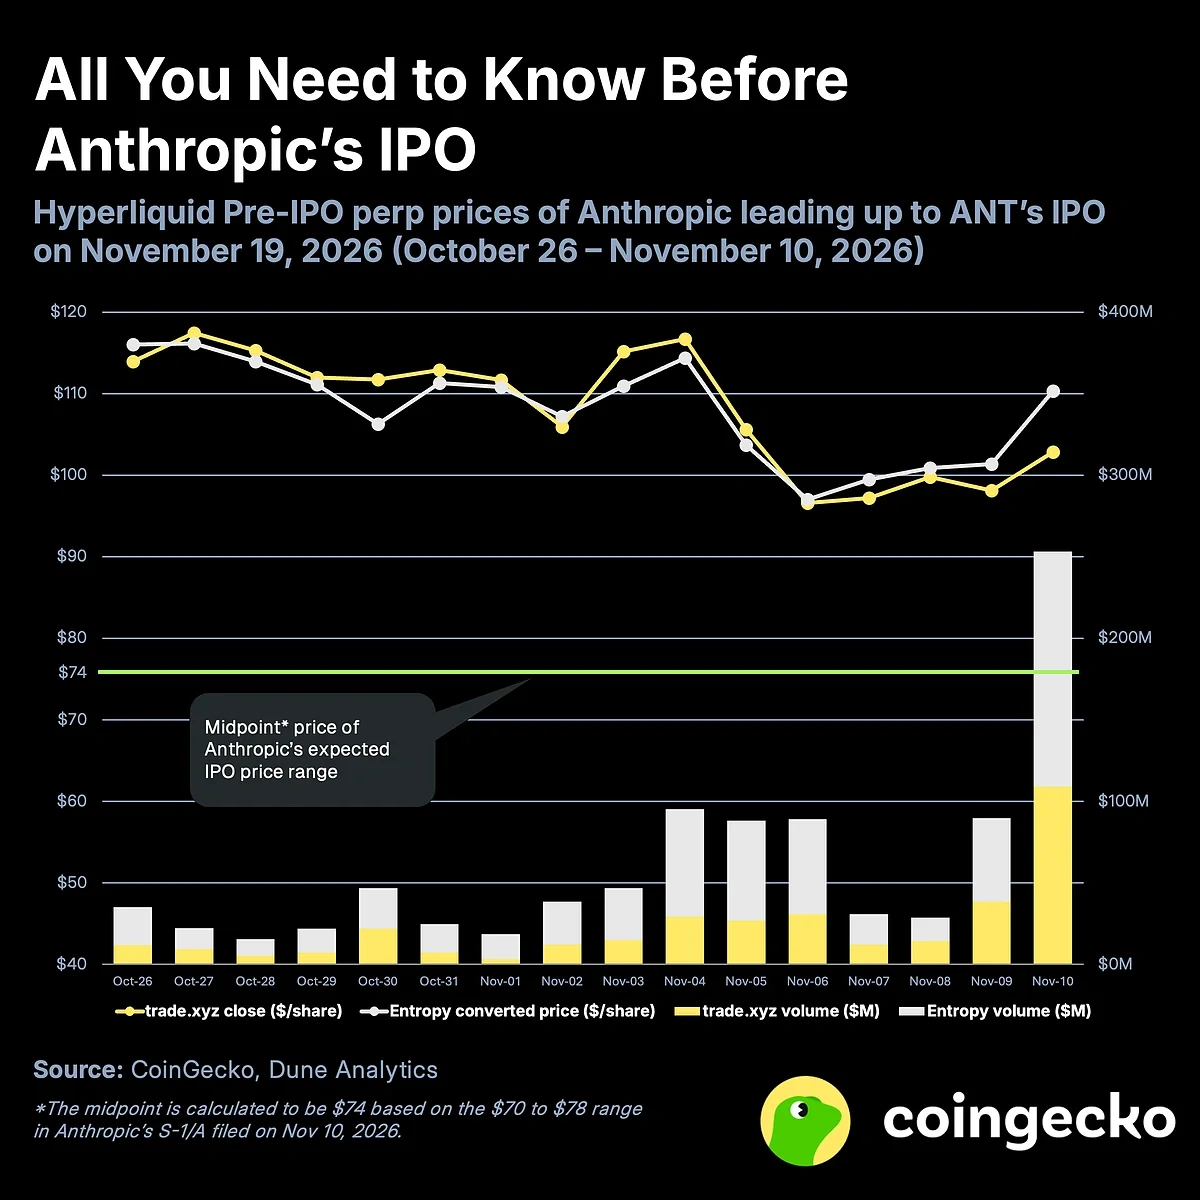
Pre-IPO contracts for Anthropic are pricing its shares well above the company’s proposed IPO range, setting up a sharp comparison when ANT begins trading on Nasdaq. The gap reflects what traders are paying in these markets; it doesn’t establish where the public offering or first exchange trade will land. That distinction matters: a contract price can signal expectations, but it isn’t a confirmed valuation for the company or a forecast of the opening trade.
The proposed offering and the pre-IPO premium
Anthropic’s Nov. 10 S-1/A sets a range of $70 to $78 per share, with $74 as the midpoint. The company plans to offer 825 million Class A shares under the ticker ANT, with trading scheduled to start on Nasdaq on Nov. 19, 2026. At the top of the range, the offering could raise about $64.4 billion. Those terms give investors a public benchmark to compare with contract prices, though the final offer price can still differ from the midpoint.
On Hyperliquid, trade.xyz’s ANT contract closed at $102.87 on Nov. 10, a 39% premium to the $74 midpoint. Entropy.io’s contract closed at $110.37, or 49.1% above that benchmark. The two venues differed by 7.29% that day, a more useful gauge of their relative pricing than Entropy’s estimated per-share price on its own. That spread is a reminder that these contracts don’t produce one definitive market view: different venues can attach different prices to the same anticipated listing.
The numbers here are striking, but they’re not a clean vote of confidence in the IPO. Contract prices reflect trading in those venues and the terms of those contracts; they don’t show how much demand the share offering will attract or what buyers will pay once exchange trading begins. This is more significant than it looks because the headline premium can seem precise even when the underlying instruments aren’t equivalent to listed shares.
What the listing will test
Anthropic’s IPO site expects the final offering price on Nov. 18, followed by the first trade the next day, subject to regulatory clearance. The key comparison will be between that first exchange price and the pre-IPO contract levels. A wide gap would show how differently these markets valued the offering before public trading began. A closer match would show that the contract prices tracked the eventual listing more closely, though one comparison still wouldn’t establish how those markets perform over time.
The terms have narrowed from figures Reuters reported on Nov. 9: a $70 to $80 range and 866.7 million shares. CNBC reports that retail investors are expected to receive about 20% of the allocation, a relatively large share for an IPO. That allocation could make the offering’s distribution a point of attention, but it doesn’t tell us how many retail buyers will receive shares or what they’ll do after trading starts.
How the contract prices are calculated
The figures use daily closes from Oct. 26 through Nov. 10, 2026, defined as the last hourly close of each US Eastern day, with prices sourced from Dune Analytics. Trade.xyz quotes xyz:ANT in dollars per share. EntropyIO quotes io:ANTH as an implied company valuation in billions of dollars; that figure was converted to a per-share estimate using 16.226 billion shares. These conventions make the two series easier to compare, while leaving a key assumption embedded in the conversion.
That share count isn’t official. It is the average of 16 daily ratios between Entropy’s implied valuation and trade.xyz’s price, so the two price series match on average by construction. Entropy’s per-share estimates and premiums are therefore indicative. Premiums are calculated against the $74 midpoint in the Nov. 10 S-1/A. Here’s the thing: because the conversion is calibrated against trade.xyz, the resulting Entropy estimate shouldn’t be treated as fully independent confirmation of trade.xyz’s price.
That’s the part readers should keep in view when comparing the quoted premiums. The $102.87 trade.xyz close is a contract price in dollars per share, while Entropy’s $110.37 figure depends on an estimated share count applied to an implied valuation. The figures can still describe what each venue was signaling, but the methods don’t make them interchangeable with a company share price. And this is the part most people overlook.
What the premium can and can’t tell you
Pre-IPO contracts can offer a live indication of how participants in those markets are pricing an anticipated event. They can also diverge from the eventual public price, especially when the contract and the listed share have different structures or trading conditions. The source figures establish a premium to the proposed midpoint; they don’t explain why traders are willing to pay it, or whether that premium will persist.
If you’re working in this space, the useful question is less whether a contract is “right” today and more what it can be compared with once a public price exists. The final offering price, the first Nasdaq trade and the contract closes are distinct reference points. A comparison among them can clarify the gap between pre-listing expectations and the opening market, while still leaving the reasons for any gap open to interpretation.
One unresolved question.
Following ANT
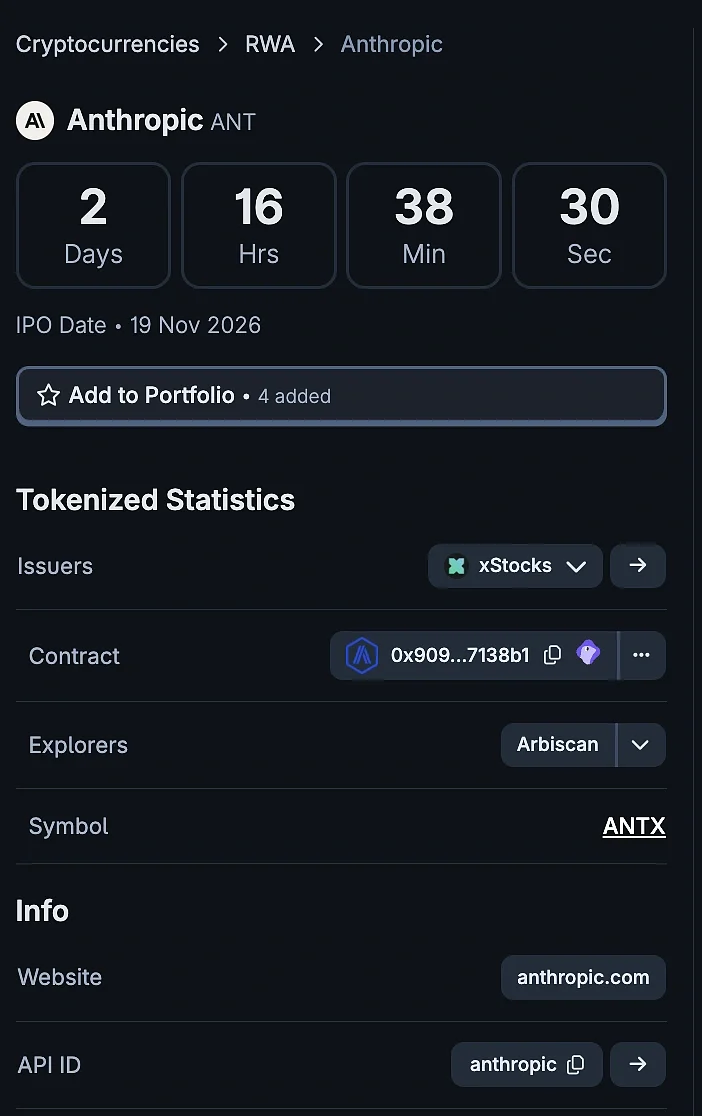
A CoinGecko ANT preview page provides a countdown to the planned listing. It can help readers track the scheduled date, though the countdown itself doesn’t indicate the offering price or predict the first trade.
The final offering price and the first Nasdaq trade will show whether the large pre-IPO premiums hold up once ANT enters public markets. What this means for you is that the contract quotes are best read as a snapshot of trading expectations, with the conversion assumptions and venue differences kept in view. The comparison will become more concrete when the public share price is available, but it still won’t explain every factor behind the market’s opening valuation.



Discussion
Sign in to join the discussion.