Bitcoin's recent rally holds steady above $81.5K as it approaches critical resistance around $82K, despite ongoing market uncertainties.


- Bitcoin is trading at approximately $81,525, reflecting a gain of over 5% in the past week following a recovery from last week's lows.
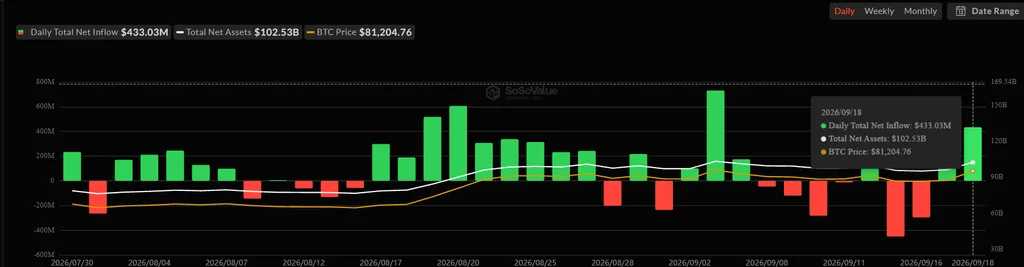
- On September 18, U.S. spot Bitcoin ETFs achieved $433 million in net inflows, with Fidelity’s FBTC and BlackRock’s IBIT leading the charge.
- According to Alex Thorn at Galaxy, reclaiming the 50-week moving average suggests bear-market lows may have been established.
Bitcoin's price surged past $81.5K on September 21, marking a significant turnaround after closing above a crucial long-term technical level for the first time in 45 weeks.
As of now, BTC is trading at around $81,525, having peaked intraday near $82,074. The cryptocurrency has risen nearly 6% over the week ending September 20, bringing its recovery to approximately 29% over the past 35 days, up from the $75,000 region seen earlier this month. This resurgence hints at a possible shift in market sentiment, which has been primarily pessimistic in recent months.
This price action coincides with last week’s impressive recovery, highlighted by the recording of $433 million in net inflows across U.S. spot Bitcoin ETFs on September 18. Fidelity’s FBTC spearheaded this trend with net inflows of about $310.7 million, followed by BlackRock’s IBIT, which accounted for roughly $108.4 million. However, total weekly ETF inflows remained modest at around $6.2 million following previous outflows. This inconsistency raises questions about the sustainability of the current rally, as investor confidence can be fickle.
Importantly, Bitcoin’s price has now reclaimed its 50-week moving average, closing above this significant indicator for the first time in 45 weeks—a development historically tied to major market recoveries. Analysts often highlight this moving average as a critical threshold. It's typical for cryptocurrencies to bounce back after surpassing long-standing resistance levels, though the permanence of that shift is always up for debate.
Bitcoin Reclaims Key Technical Indicator
Alex Thorn, Head of Firmwide Research at Galaxy, underscores the significance of the 50-week moving average as a pivotal level during Bitcoin's past bear markets. In previous analyses, Thorn noted that breaking back above this average during four out of five completed bear markets typically signaled that the lows of the market were firmly established. This aligns with broader trends in financial markets, where technical indicators guide traders' behaviors considerably.
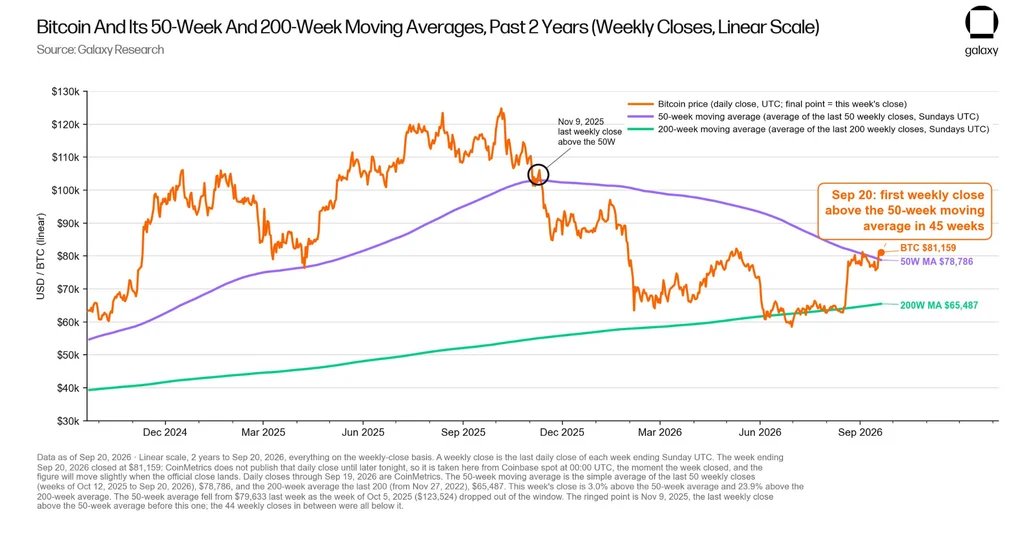
Reviewing Bitcoin's historical data illuminates why this latest weekly close is noteworthy. Galaxy's findings indicate that in 13 instances since 2011 when BTC climbed above the 50-week average, only twice did it subsequently establish new lows. This pattern can be traced back to recoveries seen after downturns in 2012, 2015, 2019, and 2023. Each of these recoveries was not without its pitfalls, though; the last downturn from 2021 to early 2022 serves as a sobering reminder that market sentiment can quickly turn, often driven by external factors such as regulatory changes or macroeconomic reports.
Bitcoin Approaches Critical $82K Resistance
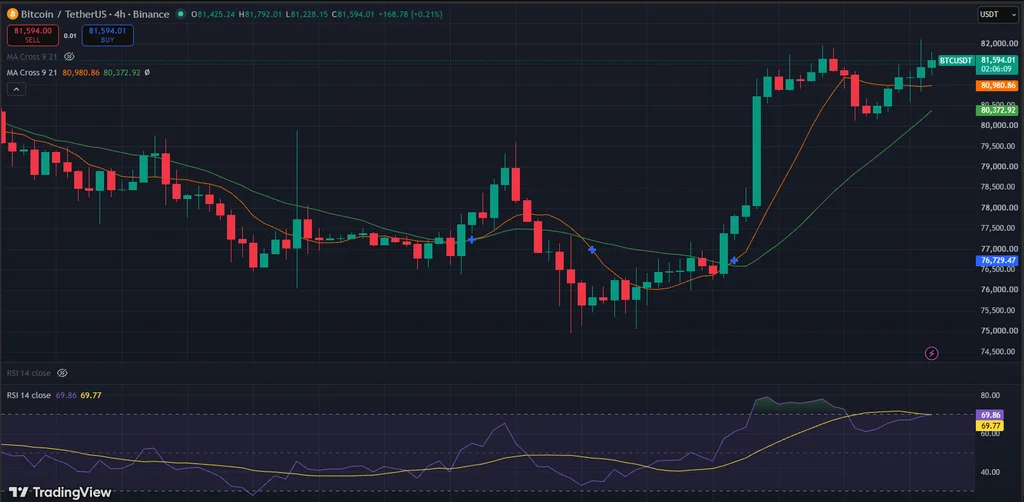
At present, Bitcoin's 4-hour chart displays a bullish momentum followed by positive consolidation. The rally from the $76,000–$77,000 range has given way to a consolidation period near recent highs. This behavior often signals traders are waiting for additional confirmation before pushing through key resistance levels like $82,000.
Current patterns show BTC remains above its 9-period and 21-period moving averages, which sit at approximately $80,981 and $80,373, respectively, preserving a constructive short-term outlook. These moving averages, while technical in nature, often become focal points for buying and selling decisions among traders. If you're working in this space, you'll know how these levels can dictate price direction in the immediate term.
The 4-hour Relative Strength Index (RSI) is hovering around 70, suggesting strong momentum but indicating that the market is nearing traditional overbought conditions. While this doesn't necessarily predict an imminent downturn, it does suggest that the buying pressure may begin to wane. Traders paying attention to the RSI often speculate about potential corrections when it reaches such levels, creating a cycle of caution amidst optimism.
The 50-week moving average, now positioned in the high $70,000 range, indicates that Bitcoin remains comfortably above this essential support level post-recovery. However, maintaining this position will be critical for the sustainability of this upward trend in the coming weeks. A failure to hold could trigger selling from traders who see this as a breakdown in momentum.
At this juncture, Bitcoin's immediate challenge lies at the key resistance level around $82,000, an area it has approached multiple times without achieving a definitive breakout. This makes it a focal point for traders considering future movements. Heavy trading around this level creates the risk of a pullback if it becomes a psychological barrier for buyers.
On the lower end, the $80,000 mark serves as the first critical support zone, with the 21-period moving average at around $80,373 providing an additional layer of short-term reference. The interplay of these levels will play a pivotal role in the coming days—will they hold, or will they crumble under selling pressure?
Despite macroeconomic pressures and regulatory uncertainties, including the Federal Reserve's decision-making and the Senate's setbacks regarding the CLARITY Act, Bitcoin's resilience above $80,000 keeps the spotlight on its potential attempt to challenge the $82,000 area again. Should the currency manage to break this threshold, it could pave the way for a more sustained bullish cycle, but caution is warranted. The market’s volatility often catches both seasoned and novice traders off guard.
Implications for Market Trajectory
This current situation presents a fascinating dynamic. The push towards $82,000 could signify more than just a price correction; it may reflect shifting investor sentiment towards risk assets. In previous cycles, rapid recoveries of this magnitude have indicated the beginning of longer-term uptrends, yet it's essential to remain grounded. Every market cycle has its unique factors, and what led to earlier recoveries may not hold true now.
The interplay between Bitcoin’s price and macroeconomic factors will likely shape the future trajectory of the crypto market. Interest rates, inflation, and regulatory clarity can serve as both catalysts and barriers, influencing not just Bitcoin, but the entire cryptocurrency sector. If Bitcoin continues to show strength above $80,000, it may draw in additional institutional investors—a sign that many analysts see as vital for advancing the market's maturity.
However, the looming uncertainties of regulation and external economic pressures may temper some enthusiasm. Bitcoin advocates often argue for its potential as a hedging asset, but the path remains fraught with obstacles. The forthcoming weeks and months will be instrumental in determining if this recent momentum translates into a sustained correction or a fleeting moment in the ongoing saga of cryptocurrency.



Discussion
Sign in to join the discussion.