Silver could reach $300 by June 2039, driven by historical bullish trends and ongoing supply deficits, despite recent price corrections.

Recent analysis suggests that silver's price, currently around $60, could surge to $300 by early June 2039. This projection, highlighting nearly a 400% potential gain, is informed by silver's long-term technical trends outlined by TradingShot in a recent TradingView post. This isn't just wishful thinking; it reflects a deep dive into the technical indicators that have historically correlated with silver prices.
The predictions of such an uptick should be treated with caution. The price of silver has experienced its share of volatility, and while historical data provides context, market conditions are constantly evolving, influenced by a variety of economic factors. The driving force behind this projected growth lies in technical analysis, where analysts look for patterns and correlations within price action over time.
Price Trends and Historical Context
Despite a brief lull after its 2026 peak, silver is said to be navigating within a century-long bullish channel. This channel has influenced price direction since the 19th century, with experts believing silver remains on an upward trajectory. The historical peaks in 1980 and 2011 serve as poignant reminders of how speculative bubbles can form, which ultimately leads to drastic corrections. But this time, what’s driving the upward trend is not just speculation; structural changes in the market are at play as well.
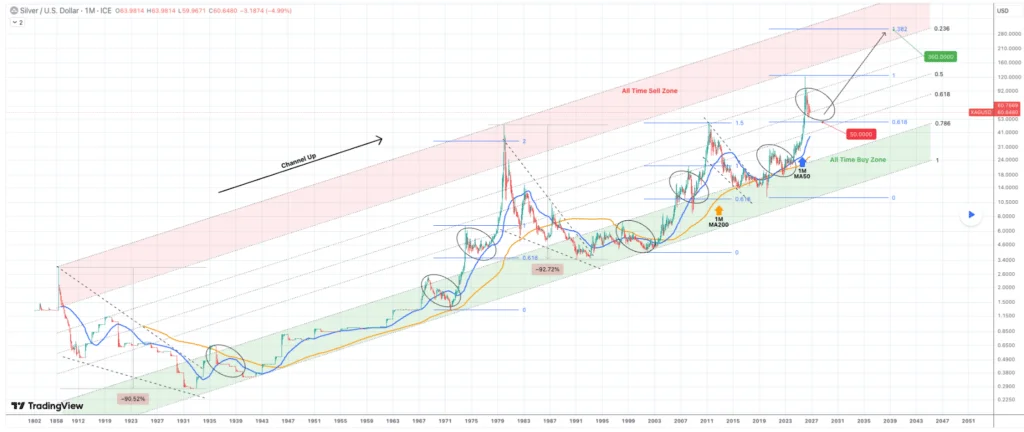
Recent technical examination indicates that silver's recent peak was just under the channel's 0.236 Fibonacci level, a region historically recognized as a “sell zone.” Such zones have previously marked the apex of price super-cycles, suggesting we may be witnessing yet another corrective phase. This dynamic is not just a technical consideration but speaks to the psychology of traders. Price action near these Fibonacci levels often results in heightened attention, thus influencing trader behavior in ways that could amplify price volatility.
Supply Deficits and Demand
The analysis points to a possible downside adjustment to around $50, aligning with the 0.618 Fibonacci retracement level and the 50-period moving average. Following this correction, an upward move toward a projected $300 price is anticipated, which would represent silver's first significant return into historical sell zones since the peaks seen in 1980 and 2011. This could create both opportunities and pitfalls for traders looking to capitalize on price swings.
Supporting this bullish outlook, the World Silver Survey has highlighted ongoing structural supply deficits. In 2025, the silver market reflected a 40.3 million-ounce deficit, a trend expected to deepen to 46.3 million ounces in 2026. If you’re working in this space, these figures should raise eyebrows. This means six consecutive years of market shortfalls, with cumulative deficits reaching approximately 762 million ounces from 2021 to 2026, contributing to diminished above-ground stocks.
While silver mining output has slightly increased, overall supply remains limited as most silver is produced as a by-product of other metals, leading to slow responsiveness to rising prices. The tricky part is that even while silver mines produce more, the dynamics of mining often alter the supply landscape in unexpected ways. If mining new deposits isn’t keeping pace with demand, you’ve got a classic scenario where prices can be pushed upward due to scarcity.
Nonetheless, investment demand for physical silver in coins and bars is projected to jump 18% in 2026, reaching around 257.6 million ounces, which compensates for declines in jewelry and some industrial demand. This shift indicates a growing recognition of silver as a store of value, particularly in uncertain economic times. Here’s the thing: when people move towards tangible assets like silver, it often highlights broader concerns about currency stability and inflation.
Despite a recent pullback driven by profit-taking, interest rate sensitivity, and efficiency-focused manufacturing reducing silver content in products like solar cells, the prevailing demand dynamics and supply constraints are likely to support higher silver prices in the long term. Profits sometimes lure traders out of positions, yet the underlying structural factors appear resilient. This diverging behavior suggests that while sentiment can shift, the fundamentals might be preparing the market for a rebound.
Implications and Future Outlook
The implications of these trends stretch beyond daily trading. They could shape the silver market for years to come. Investors should be prepared for a landscape where silver not only serves traditional roles—like jewelry and industrial applications—but increasingly acts as a hedge against inflation and economic instability. If you’re looking for opportunities in precious metals, keeping a close eye on the factors affecting silver is essential. This isn’t just another metal; it’s a battleground of supply, demand, and speculation.
However, similar systems typically experience sentiment shifts based on macroeconomic indicators. As we approach 2039, evolving economic climates—such as inflation rates and global market dynamics—will influence silver's trajectory. And yet, those bullish projections of $300 won’t mean much without solid fundamentals backing them up. Price history teaches us that unless the factors driving demand and hindering supply align effectively, predictions can often fall flat. Those predicting a meteoric rise must ensure they’re not ignoring underlying economic realities.
Featured image via Shutterstock
The original article can be found here.



Discussion
Sign in to join the discussion.