Bitcoin’s short-term indicators have turned positive, but the weekly close below $82,500 leaves the next move dependent on reclaiming resistance.


Recovery meets a key resistance test
Bitcoin’s near-term momentum has improved, but its weekly close below $82,500 leaves the recovery at a decision point. BTC was trading around $82,324, with $26.63 billion in volume. Its 24-hour range was $80,671 to $83,035, while the article reports a weekly range of $79,805 to $74,074. That mismatch in direction may reflect the way the range is presented, so the figures are best read as the reported endpoints rather than a signal about which way price moved.
The immediate question is whether the recent improvement can hold above a level that has mattered on the chart before. Short-term gains can change the tone quickly, but a weekly close below resistance leaves a more cautious signal in place. This is more significant than it looks: the same price area is being used to judge both whether the downtrend break has traction and whether sellers still have the upper hand.
$82,500 is the level to reclaim
The $82,500 area carries weight on the chart: it marked the May 2026 highs and acted as a continuation level in early 2025. Bitcoin’s daily close above the October downtrend offered a positive signal, yet the subsequent weekly close beneath this price complicates that reading. Those timeframes tell different parts of the story: the daily close suggests a change in near-term direction, while the weekly close cautions that the broader move has not cleared a key hurdle.
A weekly close below resistance can put that level back in the role of resistance. Unless BTC reclaims it on shorter timeframes, especially on a daily close, the downtrend break is harder to treat as a meaningful shift. A move back above $82,500 would make the weekly close look more like a shakeout; failure to recover it would weaken the case for continuation. The distinction matters because a brief move through a level and a close that holds above it carry different weight for traders assessing follow-through.
The source points to two previous periods of tight price compression: one preceded a move from $64,000 to $80,000, and another a rise from $76,000 to $86,000. That history shows compression can precede a large move, but it doesn’t establish its direction. Similar periods of narrow trading can resolve either way, so the earlier examples provide context rather than a forecast. The stated short-term bias remains bearish below $83,400, with BTC potentially contained in its current range until a clearer move develops.
Nearby levels leave little room for certainty
On the downside, the article identifies $82,218 as a potential support test if selling strengthens, followed by a possible move toward $82,100. If buyers regain momentum, it puts nearby resistance at about $82,401 and says a push above $82,500 could follow. These levels sit close together, underscoring how tightly BTC is trading around the key threshold. The proximity makes the chart sensitive to relatively small moves, and it gives little basis for reading a brief price swing as a settled direction.
Here’s the thing: when support and resistance are clustered this closely, the sequence of closes may tell more than a single intraday touch. A move toward $82,218 would test whether buyers are still defending the area; a recovery through the nearby resistance would improve the short-term picture. Neither outcome, by itself, would settle the larger question around $82,500. If you’re working in this space, the practical distinction is between momentum that appears during a session and a close that confirms price can hold beyond a contested level.
Indicators lean positive, with limits
The MACD line is above zero while its signal line remains below, a configuration the source describes as a fast bullish shift. That points to improving short-term momentum, while the longer-term trend is still recovering from a weak stretch. The signal line has yet to confirm a fuller reversal by crossing above zero, so the indicator’s positive turn remains an early-stage reading. It’s a change in momentum, not proof that the broader trend has turned.
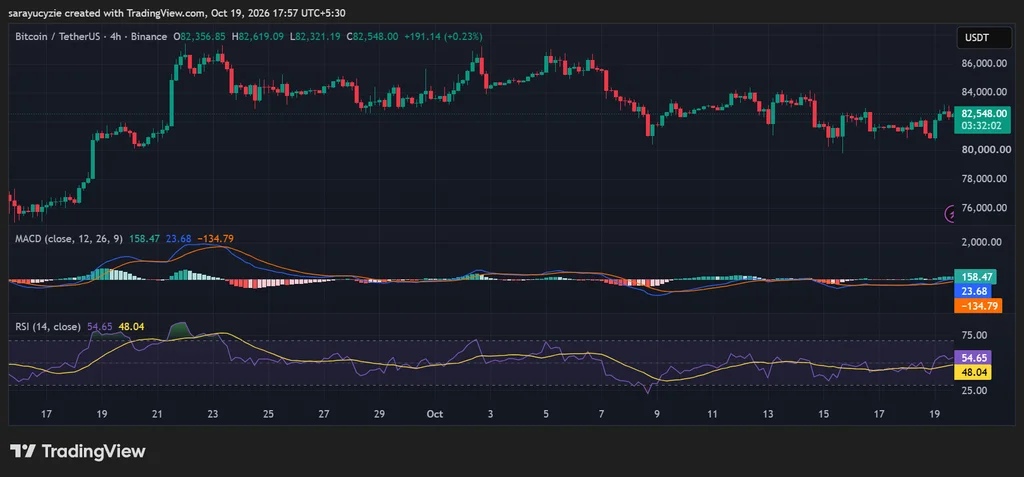
The daily RSI stands at 54.65, modestly above the neutral 50 mark. That supports a mild bullish bias, but leaves room for movement in either direction. A reading above 60 would offer stronger evidence of sustained momentum; at current levels, buyers have only a slight edge. The indicator’s message is restrained: there’s some evidence of buying strength, but not enough to make the weekly resistance test irrelevant.
What the next move could clarify
For now, the chart’s near-term case hinges on whether Bitcoin can reclaim $82,500 and then make headway above $83,400. Until those levels give way, positive momentum indicators and a bearish weekly close remain in tension. A recovery through both would strengthen the argument that the daily downtrend break is gaining follow-through; continued rejection would leave the bearish short-term bias intact.
And yet. A narrow range can persist, and the compression examples cited here don’t tell readers when a breakout will arrive or which direction it will take. That’s why the levels matter more than a confident prediction: they give traders a way to judge whether momentum is holding up as price tests resistance. The chart offers a developing setup, not a settled verdict.



Discussion
Sign in to join the discussion.