A $1,000 investment after the 1987 crash would have grown to about $34,000 in the S&P 500 or nearly $29,909 in the Dow, before dividends.

Nearly four decades after Black Monday, the scale of the market’s recovery is striking: a $1,000 investment in the S&P 500 after the October 19, 1987 crash would be worth about $34,000 today, excluding reinvested dividends. That figure captures the effect of a long rise in share prices, but it doesn’t describe a smooth journey. Investors would have had to endure repeated downturns and periods of uncertainty to remain invested long enough to see that result.
The 39th anniversary of Black Monday offers a long view of how markets have changed since the worst single-day crash in Wall Street history. The S&P 500 dropped 20.47% that day, closing at 224.84, as global losses reached roughly $1.71 trillion. The scale of the one-day decline still gives the episode its place in market history, while the decades of recovery show how sharply a long-term comparison can differ from the shock investors experienced at the time.
There’s a catch in reading that recovery as a simple lesson about patience: an index’s later performance can’t erase the risk of holding through a severe fall. The headline comparison describes what a hypothetical investment would be worth at the stated index level. It doesn’t show how any individual investor might have responded to losses along the way, or whether they would have stayed invested.
What the S&P 500’s recovery means for $1,000
Using the index’s value of 7,659.44 at the time of writing, the comparison puts its rise since the crash at approximately 3,306%. A similar percentage drop today would take more than 1,568 points off the index. That points calculation translates a historic percentage decline into the index’s present scale; it isn’t a forecast that such a fall will occur or an estimate of what an investor’s portfolio would lose.
Investors can access the S&P 500 through a range of products, but this calculation tracks the index itself. That distinction matters because an index figure doesn’t include the specific costs, holdings, or other features of an investment product. The comparison is useful as a measure of broad price appreciation, but it shouldn’t be mistaken for a complete account of an investor’s returns.
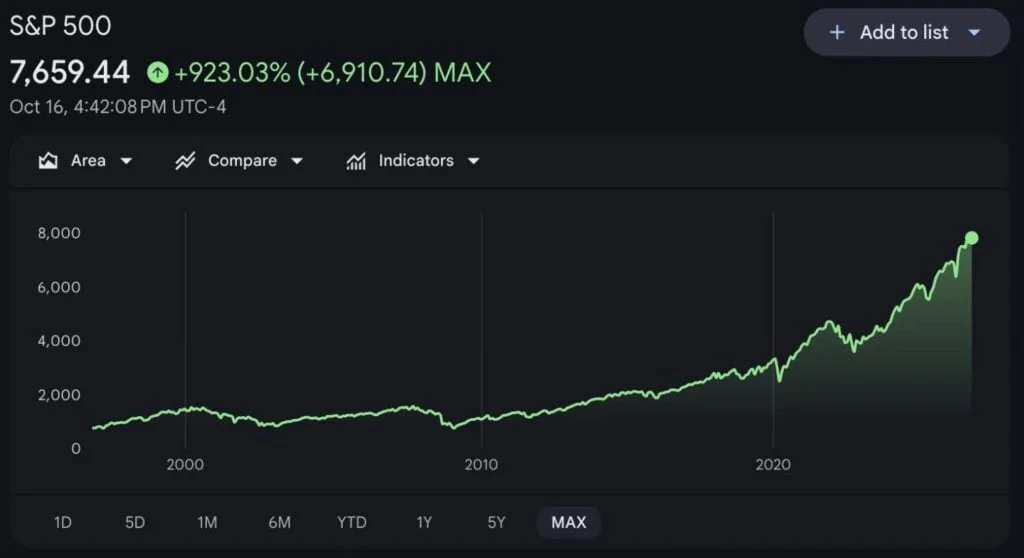
That estimate leaves out dividends. Reinvesting them would have raised the total substantially, potentially doubling it, though the result depends on the average yield used for the period after the crash. In other words, the $34,000 figure is a price-only comparison, and the article’s dividend estimate is conditional rather than a precise total return calculation.
This is more significant than it looks: dividends can compound when they’re reinvested over a long period, so excluding them can leave a large gap between index price growth and a hypothetical total return. The size of that gap depends on the assumptions used. Here’s the thing: the headline figure is striking precisely because it’s simple, while the actual experience behind it would have been more complicated.
The Dow’s long climb
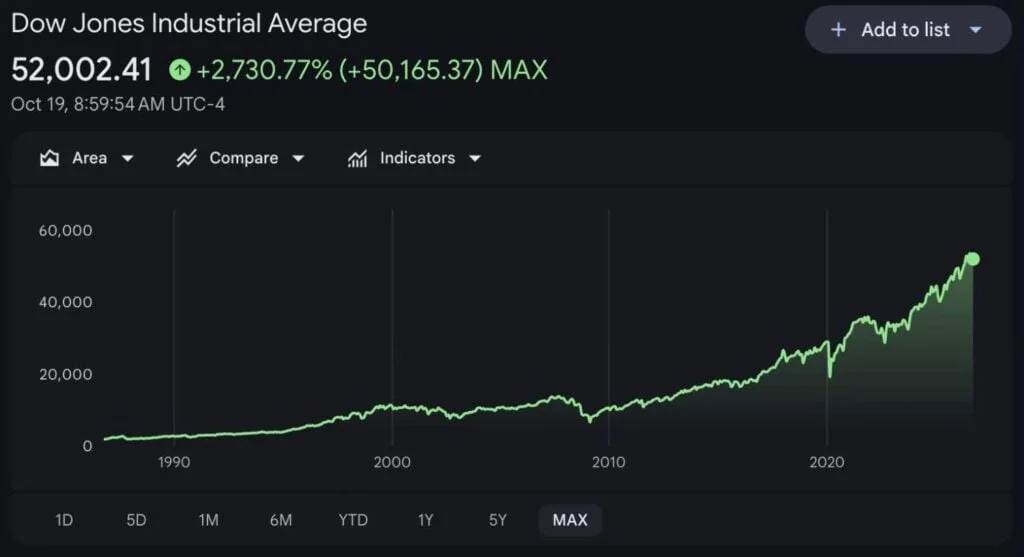
The Dow Jones Industrial Average fell further on Black Monday, losing 22.6% to close at 1,738.74. The decline erased about $500 billion. At a current reading of 52,002.41, a drop of the same size would cost the index roughly 11,752 points. The point comparison illustrates how the same percentage move translates into a much larger number of index points when the index stands at a higher level.
A $1,000 investment in the Dow at the time would now be worth about $29,908.90, a gain of 2,890.89%. As with the S&P 500 figure, that estimate excludes dividend reinvestment, which would have added to returns over the years. The two index comparisons offer a broad view of price growth over the period, but they don’t establish which would have been the better choice for a particular investor.
What the comparison leaves out
Long-run index growth can make a crash look like a small interruption when viewed from far away. At the time, though, a fall of more than a fifth in one session would have been a severe test of investor confidence. And this is the part most people overlook: the final value of a hypothetical investment says little about the uncertainty involved in holding it through the intervening years.
If you're working in this space, the figures are best read as historical illustrations, not as a promise that markets will follow the same path again. They show how much broad index prices rose from the stated starting point to the stated current readings. They don’t reveal the sequence of returns, account for an investor’s timing, or include dividends in the quoted totals.
That said, the comparison remains useful. It places Black Monday’s extraordinary losses beside the subsequent scale of recovery, while the dividend caveat shows why price-only figures can understate long-term gains. The numbers here are underwhelming as a guide to what happens next, but powerful as a reminder of how different the long view can look from the day of a crash.
Long recovery. Uneven path.
Featured image via Shutterstock
The post $1,000 invested after the 1987 Black Monday crash would now be worth this much appeared first on Finbold.



Discussion
Sign in to join the discussion.