XRP once surged after roughly 742 days of consolidation. Traders are debating whether that history offers any clues about its next move.
XRP’s price history offers a striking example of how long a market can drift before momentum turns. The token spent about 742 days trading in a narrow range before climbing dramatically during the 2017–2018 bull run, a sequence that’s now being cited by holders facing sluggish price action. The comparison is compelling as a story, but it doesn’t establish that another surge is near: a long stretch of quiet trading can precede a breakout, yet it can also simply remain a long stretch of quiet trading.
What the 2017–2018 chart shows
Vandell Aljarrah, co-founder of Black Swan Capitalist, argued for patience in a post on X. “Losing patience during market stagnation is a novice mistake,” he wrote, pointing to XRP’s extended consolidation before its major rally. That’s a view about how investors should interpret a chart, not evidence that the same conditions are in place now.
The weekly chart he shared shows XRP trading at roughly $0.004 to $0.011 for about 742 days. The token broke out in 2017 and reached its cycle peak in January 2018, with the chart depicting a roughly 630-fold increase over the measured move. Long periods in a narrow range can make a later rise look especially dramatic on a chart, since the starting price is so low. But the visual impact doesn’t explain what caused the move or whether those causes are likely to recur.
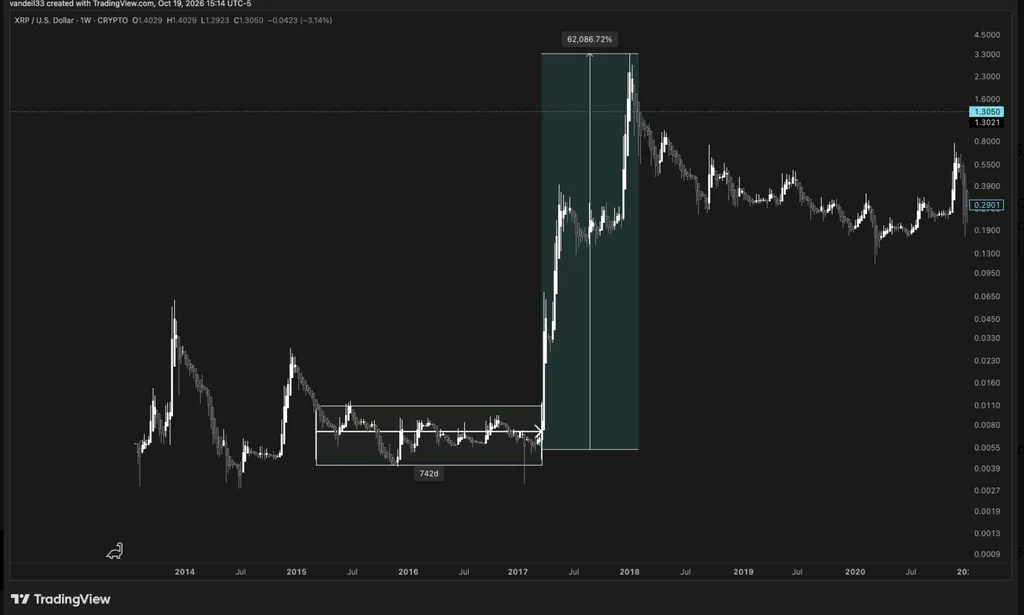
The rally’s precise percentage depends on which starting price and exchange data are used. One commenter put the gain at about 64,000%, comparing an estimated $0.006 starting point with a peak of $3.84. Aljarrah replied that measuring from XRP’s 2014 cycle lows to its January 2018 peak yields an increase of about 119,000%. Those figures describe different measurement windows, so they shouldn’t be treated as competing calculations of one identical move.
A historical parallel, with limits
That spread in estimates highlights a basic problem with headline rally figures: changing the starting point can change the result substantially. A percentage gain calculated from a very low price can sound enormous while offering little practical guidance about what comes next. The broader pattern is easier to state: XRP traded sideways for an extended period before its 2017 breakout. That sequence alone can’t tell investors when, or whether, another breakout will happen.
Some XRP community members question whether the earlier performance can be repeated in today’s crypto market. They point to a changed market structure, including the greater role of market makers and concerns about alleged manipulation. Those arguments raise a fair question about how closely two periods can be compared, but they don’t by themselves prove that the earlier rally is impossible to repeat. And memories of a dramatic past gain can make a historical chart feel more predictive than it is.
Here’s the thing: a chart can show what happened, but it can’t identify every condition that made it happen. A prolonged consolidation may reflect a pause in trading, shifting demand, or other forces; the chart alone can’t distinguish among them. (And this is the part most people overlook.) Without a clear account of the forces behind the earlier move and the conditions in the current market, the 742-day interval is a reference point, not a timetable.
What the current price says—and doesn’t say
At press time, XRP traded at $1.31, down 5.2% for the day, according to CoinGecko data. The token remained about 64% below its then-current all-time high of $3.65. Those figures put the discussion in context: XRP had fallen well short of its previous peak, while a single day’s decline showed that the price was still moving in both directions.
Applying a 62,000% gain to the press-time price would put XRP at $814.81. That calculation illustrates the scale of the past rally; it isn’t a forecast, and the source provides no basis for treating it as one. A large historical percentage can be mathematically accurate and still tell you very little about the odds of reaching a particular future price. The starting point, time period, and market conditions all matter.
The numbers here are underwhelming as a predictive tool. They can support a case for patience, but they can’t settle whether patience will be rewarded. If you’re working in this space, the useful distinction is between recognizing a historical pattern and claiming that it supplies a reliable signal for a future move.
Why the comparison still matters
XRP’s 2017–2018 run remains a memorable case of prolonged consolidation preceding a sharp advance. It helps explain why some holders resist reading a quiet market as a verdict on the token’s prospects. Yet that interpretation is only one possible reading. A sideways chart doesn’t guarantee that pressure is building toward an upward move; it can also reflect uncertainty or a lack of decisive demand.
That said, the historical example has value as a reminder that price action can change sharply after extended inactivity. It gives supporters a concrete episode to cite when arguing that current stagnation needn’t last forever. The limit is just as clear: a past outcome can frame today’s debate, but it can’t resolve it. Any comparison has to account for how different market conditions may be, and the available facts here don’t establish that the old setup has returned.
XRP’s history can make patience seem sensible. It can’t tell holders how long to wait, or promise that the next chapter will resemble the last one. A precedent, not a promise.



Discussion
Sign in to join the discussion.