Gold has dropped about 25% since the war began, even as gold ETFs drew billions in inflows and global holdings reached a record.

Gold’s decline since the US-Israeli war against Iran began on February 28 shows how quickly inflation and interest-rate concerns can outweigh demand for a perceived safe haven. Spot prices have fallen about 25.3%, from $5,378 an ounce on March 2, the first trading day after the conflict began, to roughly $4,021 by press time. That’s a sharp change in direction for an asset many investors turn to when geopolitical risks rise. But gold’s appeal depends on more than fear: the cost of holding it, the strength of the dollar and expectations for inflation can all shift the balance.
Bullion briefly slipped below $4,000 early Monday before recovering. The move is a sharp reversal after gold initially climbed on demand for defensive assets. The rebound doesn’t erase the scale of the drop, and a brief recovery alone can’t establish that the selling has run its course. It does show that prices can respond quickly as traders reassess the same conflict through different economic channels.

Energy costs have shifted the calculus
Concerns about energy supplies and shipping through the Strait of Hormuz have raised the prospect of higher oil prices, persistent inflation and delayed rate cuts. Higher yields on bonds can make gold less appealing, while a stronger US dollar, profit-taking after the pre-war rally and forced selling in futures markets have added pressure. The connection is indirect but consequential: when investors expect interest rates to stay higher, assets that pay interest can look more attractive beside gold, which doesn’t generate income. And when the dollar strengthens, gold can become more expensive for buyers using other currencies.
Here's the thing: geopolitical uncertainty doesn't guarantee rising gold prices. Central-bank purchases and diversification away from the dollar continue to underpin the metal’s long-term role as a store of value, but rising real yields and selling during market stress can outweigh those supports. In a crisis, investors may sell liquid holdings to cover losses or meet cash needs elsewhere, even if they still value gold as a longer-term hedge. That’s the part many simple “safe haven” explanations miss: the label describes a role, not a promise of immediate gains.
This is more significant than it looks. The fall suggests markets are weighing the economic consequences of the conflict alongside the direct risk of further disruption. If energy costs feed inflation, the prospect of rate cuts may recede; that can pressure gold even as uncertainty remains high. A safe-haven asset facing a higher opportunity cost. That tension is central to understanding the price move.
ETF inflows point to continued demand
The price slump hasn’t stopped investors from buying gold-backed exchange-traded funds (ETFs). Global funds took in about $10 billion net, equivalent to 67 tonnes, in September, despite an 8.5% fall in gold prices, according to the World Gold Council. These flows offer a different view of demand from the spot price: the price reflects trading across the market, while fund flows show whether investors are adding to or withdrawing from a particular group of investment products.
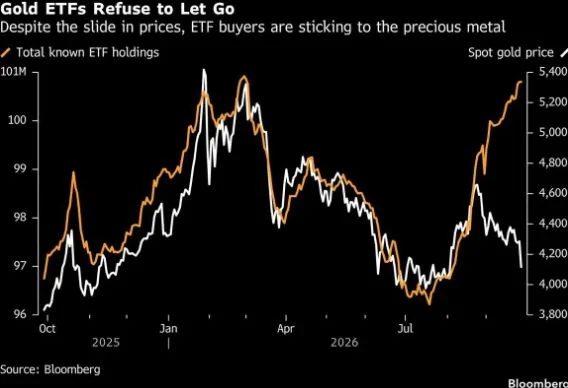
Those purchases brought global holdings to a record 4,256 tonnes at September’s end. Net inflows for the third quarter also set a record, at $31 billion. The figures indicate that demand persisted through a period of falling prices, although they don’t show what every investor expects next or how long that demand will last. Fund buying can provide support, but it can’t prevent prices from responding to shifts in rates, currencies or trading conditions.
The contrast with falling spot prices suggests some investors are adding to positions or holding for the longer term through geopolitical and financial uncertainty. Selling pressure in the broader market remains a counterweight. ETF inflows and a falling market aren’t mutually exclusive: different investors can act on different time horizons, and purchases in one channel needn’t outweigh selling elsewhere. If you're working in this space, the practical point is to read the flow data alongside prices and interest-rate expectations, rather than treating either one as a complete signal.
The September figures also have a limit as evidence about current sentiment. They describe a specific period, while the price move in the article extends from March 2 to press time. They establish that funds attracted substantial net buying during the reported month and quarter; they don’t, by themselves, explain every daily swing or establish that the same pattern will continue. The distinction matters because a record in holdings can coexist with a sharp pullback in the market price.
What could shape gold’s next move
For the rest of 2026, the direction of oil prices, inflation and Federal Reserve policy will matter. Cheaper oil and lower interest rates could help gold recover; further escalation, persistent inflation or a stronger dollar could extend its decline. These forces can pull in opposite directions, and the source figures don’t settle which will dominate. Any recovery case therefore depends on how those conditions develop, rather than on geopolitical risk alone.
The wider lesson is that investors can’t treat gold as a simple gauge of fear. A conflict may increase demand for protection while also raising energy costs and inflation expectations, which can support higher yields and weigh on bullion. The balance can change as market expectations change. That said, the record ETF holdings and inflows suggest that falling prices haven’t erased all appetite for gold exposure.
For readers, the useful question is what’s driving the next leg of the move: demand for defensive assets, expectations for borrowing costs, currency strength or selling pressure. No single indicator answers that on its own. Gold’s recent decline shows how a familiar hedge can come under pressure when the economic consequences of a crisis point in the other direction.
Featured image via Shutterstock
The post Gold has crashed over 25% since the US-Iran war began appeared first on Finbold.



Discussion
Sign in to join the discussion.