Peter Brandt sees a potential weekly head-and-shoulders top as Bitcoin slides; analysts also report rising realized losses and a possible deep-value zone.


A chart pattern puts Bitcoin’s record under scrutiny
Bitcoin’s next move around $60,000 to $65,000 may determine whether a bearish chart pattern is taking shape. Veteran trader Peter Brandt has raised the possibility of a weekly head-and-shoulders top, saying that if the pattern proves valid, he could make a technical case that Bitcoin’s October 2025 record of $126,080 will stand for the rest of his lifetime. That’s a strikingly long horizon for a claim built on a chart structure that hasn’t yet been confirmed.
Brandt raised the possibility in a November 15 post on X, but stopped short of calling the pattern confirmed. A head-and-shoulders top has three peaks, with the middle peak higher than the two on either side. The neckline connects the troughs between those peaks; a decisive break below it is commonly read as a sign that the prior uptrend may be reversing. The pattern is a way of organizing price history, not a guarantee of what comes next.
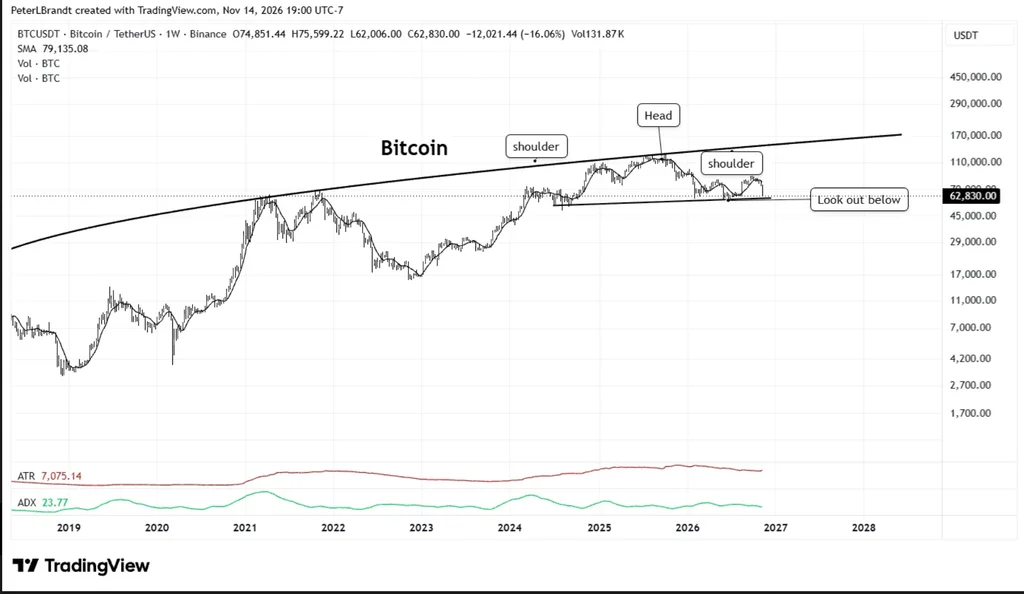
For Bitcoin, the $60,000–$65,000 band is the potential neckline and a key support area to watch. A break below it could lend weight to the bearish reading, while the pattern remains uncertain until price action confirms the structure. Brandt’s lifetime-high scenario is therefore conditional, not a prediction that Bitcoin has already made its final peak. The distinction matters: traders can discuss a setup before the market confirms it, but the setup’s interpretation can change as prices move.
Why the neckline matters
In a head-and-shoulders pattern, the three peaks suggest that buying strength has changed over time: the middle peak rises above the surrounding highs, while the later peak falls short of it. The neckline gives analysts a reference point beneath those peaks. If price falls through that area decisively, the pattern is often treated as stronger evidence that the earlier upward trend has weakened.
That framework helps explain why the $60,000–$65,000 range has drawn attention. It’s not simply another price band in the discussion; it’s the area Brandt’s reading identifies as potential support and the pattern’s neckline. A hold would leave the bearish interpretation unresolved. A break could make it more persuasive, though it still wouldn’t turn a chart pattern into certainty about Bitcoin’s long-term direction.
Here’s the thing: technical labels can make uncertain price action sound more settled than it is. A pattern can look recognizable while it’s forming, then fail to complete or lose significance as the market changes. The evidence described so far is conditional, and Brandt’s own qualification reflects that. The market still has to supply the next part of the story.
Losses mount as Bitcoin extends its decline
Selling intensified on Nov. 13, when Bitcoin fell below $70,000 for the first time since August. Its weekly loss reached about 14.8%, adding to pressure across crypto markets. A move of that size can sharpen attention on support levels because traders are left weighing whether the decline is a temporary setback or part of a larger change in trend. Price alone doesn’t settle that question.
Analyst James Check described the sell-off as Bitcoin’s fourth capitulation event since its record high. He said daily realized losses more than doubled in 24 hours, rising from about $420 million to over $850 million. Realized losses reflect the value of coins sold below their earlier purchase price, so the measure captures losses that have been locked in through transactions. It can help describe the force of selling, but it doesn’t reveal by itself how many holders remain willing to sell or when pressure will ease.
Check also said Bitcoin had entered a “deep value” zone, a range he said it last reached in February and late June this year, with the prior comparable episode occurring during the 2022 crypto bear market. He cautioned that this reading doesn’t establish a market bottom. That caveat is central: a historical comparison can give context to current conditions, but it can’t guarantee that the same outcome will follow this time.
What the competing signals mean
The chart discussion and the loss data point to different parts of the same problem. Brandt’s potential pattern focuses on whether price can hold a specific support area; Check’s account describes the scale of losses realized during the sell-off. Together, they show why a falling market can generate both bearish technical concerns and arguments that prices have entered a value range. Those interpretations aren’t mutually exclusive.
And yet, neither signal answers the immediate question on its own. A support level can fail even after heavy selling, while a sharp wave of realized losses doesn’t prove that sellers are exhausted. The next price action around $60,000 to $65,000 will therefore carry unusual weight in this account: a break could reinforce Brandt’s bearish reading, and a hold would leave it unconfirmed. Still, one outcome at that level wouldn’t resolve every question about the wider market.
This is more significant than it looks because Brandt’s claim reaches beyond a near-term chart call. Saying Bitcoin’s record could stand for the rest of his lifetime frames the potential pattern as a possible end to a long advance, but the underlying condition remains unmet. The contrast between the scale of that claim and the uncertainty of the evidence deserves attention.
If you're working in this space, the practical distinction is between a warning signal and confirmation. The range gives market watchers a concrete area to follow, while the realized-loss figures describe what sellers have already done. Neither tells readers what Bitcoin must do next. The unresolved question is whether support holds.
For now, the evidence supports caution in interpreting both the technical pattern and the “deep value” label. The pattern could gain credibility if Bitcoin decisively falls below its potential neckline; if the range holds, Brandt’s scenario remains unconfirmed. Check’s historical comparisons add perspective, but his warning against treating them as a bottom call is just as relevant. A test of support, and what follows it.



Discussion
Sign in to join the discussion.