XRP fell 23.4% since November 4, outpacing Bitcoin, Ether and Solana. EGRAG Crypto weighs leverage, veteran selling and manipulation as the likely causes.
Bitcoin, Ether and Solana have all bled during November's crypto sell-off. XRP, though, is getting hit harder than any of them, and that gap is hard to shrug off. Crypto analyst EGRAG Crypto says the underperformance isn't random, and he points to three possible drivers that could keep the token under pressure. Sell-offs usually spread the pain unevenly, but a token falling this much faster than the market's anchor deserves a closer look.
XRP Is Falling Faster Than Its Majors
In a Nov. 10 post on X, EGRAG Crypto laid out how far each major asset has fallen since November 4. XRP led the group with a 23.4% decline. Ether dropped 18.2%, Solana slid 17%, and Bitcoin, the most resilient of the four, lost 10.4% over the same stretch. Worst to least bad, in that order.
That spread is the real story. A broad sell-off usually drags everything down together, so when one large-cap token drops more than twice as fast as Bitcoin, it's worth asking what's specific to it. Here's the thing: a 23.4% drop against a 10.4% drop is roughly a 2.25-to-1 ratio, and that ratio is what separates a market-wide mood from an asset-specific problem. Broad selling tends to move the big names in rough lockstep, with differences driven mostly by how much each one ran up beforehand. When the gap persists, the explanation usually lives inside the asset rather than in the macro backdrop. (And this is the part most people skip when they just scan the headline percentages.)
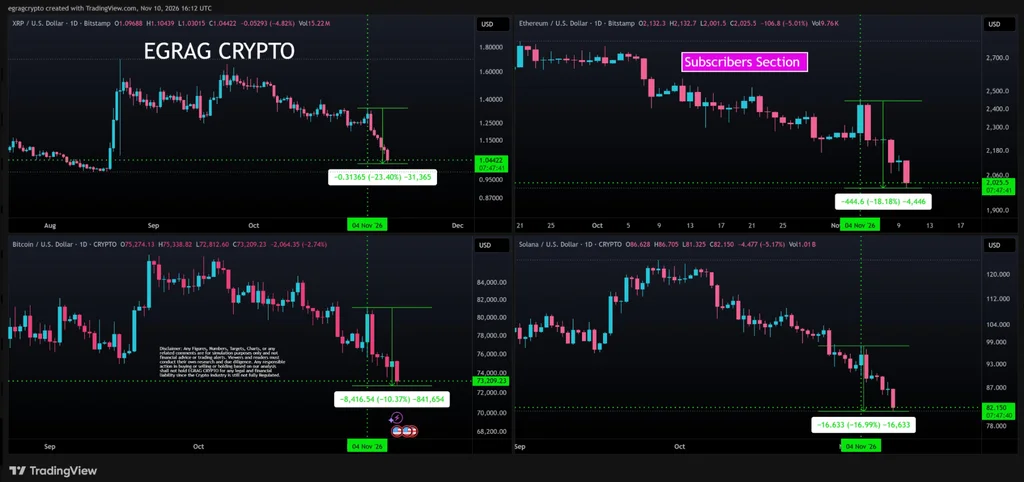
The chart embedded above gives you the visual shape of the move. The percentages in the post are what you'll want for direct comparison, though. Charts show where the damage landed but not why it landed there, and that's the gap the analyst's three theories are trying to fill.
Three Possible Headwinds
EGRAG Crypto doesn't just describe the slide. He offers three explanations and assigns each a rough probability, which is an unusual move for a market commentator. Probabilities like these are judgment calls, not measurements. Still, they give you a clear ordering of what he thinks matters most, and that ordering says a lot about where his instincts lie.
His first suspect is long liquidations, which he puts at a 30% probability. Long positions are bets that prices will rise, and many traders place them with borrowed money. When prices fall, those positions get closed automatically, and the forced selling pushes prices lower still. Thin buying demand makes this worse, because there's little on the other side to absorb the sales. Liquidation cascades are a common feature of crypto downturns, and they can carry prices through levels that would otherwise have held.
The second candidate, at 20%, is selling by early holders. The analyst suggests longtime investors, often called OGs, may be taking profits and rotating into other tokens. That's a plausible story, and it has a certain logic. Early holders often have large positions and low cost bases, so they have the most room to sell and the most reason to lock in gains. That kind of exit gets louder when large holders decide to cut exposure in shaky conditions.
The heaviest weight goes to the third explanation. EGRAG Crypto assigns a 50% probability to market manipulation, or a deliberate liquidity hunt. In that scenario, sharp moves are engineered to trigger stop-loss orders and shake out weaker hands before any recovery. He believes this best explains why XRP is taking disproportionately heavy selling. And yet, it's the hardest of the three to verify from the outside, which is exactly why it's worth reading the number skeptically.
It's worth being clear about what these numbers are. They reflect EGRAG Crypto's own probability estimates, not verified evidence of what's driving the decline. Not proof. Just a theory with numbers attached. Treat them as a framework for thinking about the move, not a conclusion.
The Levels He's Watching
EGRAG Crypto has also flagged prices that could shape the next leg. He sees the $1.00 to $1.04 range as a critical stabilization zone. If XRP can hold that area, the analyst argues it could establish a floor amid the current selling. Round numbers like $1.00 tend to attract attention from traders regardless of fundamentals, so a zone that straddles one carries psychological weight. Whether it actually holds depends on buyers showing up in size there, not on the number itself.
On the upside, bulls need to reclaim $1.15 before aiming for $1.25. Getting above those thresholds would suggest buying momentum is improving and might bring some relief to recent buyers. The ladder works in both directions, though. A level that's reclaimed quickly tells you sellers are exhausted, while one that gets rejected twice tells you the supply overhead is still heavy. Watch how price behaves at each rung, not just whether it touches it.
His personal read leans toward manipulation designed to scare newer investors into selling. That's a pointed claim, and it's the one I'd push on hardest. He also raised a bigger question about whale behavior. Are deep-pocketed holders using the dip to accumulate, or are they adding to the supply by offloading?
That answer may matter most. If large wallets are absorbing what's being sold, the sell-off could run out of steam. If whales keep distributing, a recovery gets much harder for the sixth-largest cryptocurrency. Watch the whale data as closely as the price chart here.
What This Means If You're Following XRP
If you're following this token, the most useful takeaway isn't any single probability. It's the set of observations that would confirm or undercut each theory. Liquidation-driven selling tends to clear quickly and then fade, while steady selling by early holders shows up as persistent outflows over a longer stretch. Manipulation, if it's happening, usually leaves a pattern of sharp moves through key levels followed by fast reversals. Those signatures are different enough that the next few weeks should narrow things down.
The bigger implication is about how to read analyst commentary in a fast-moving market. Assigning probabilities to competing explanations is more honest than declaring a single cause, but it also invites false precision. A 50% estimate for manipulation sounds rigorous until you ask what evidence would move it to 60% or 40%. Ask that question of any analyst, and you'll learn more than the headline numbers tell you.
Being the sixth-largest cryptocurrency cuts both ways. XRP is big enough that its moves matter beyond its own holders, and that's the reason this underperformance deserves attention. But it's also a token that gets pulled along with the rest of the market when sentiment turns. The question worth tracking is whether the gap closes or keeps widening, and whether the whale data backs up any one explanation over the others.


Discussion
Sign in to join the discussion.